Normal Distributions and Risk-Return
Managers often ask questions such as:
- How severe could losses be next year?
- What is the range of likely outcomes?
- How confident can we be about the forecast?
Normal Distribution
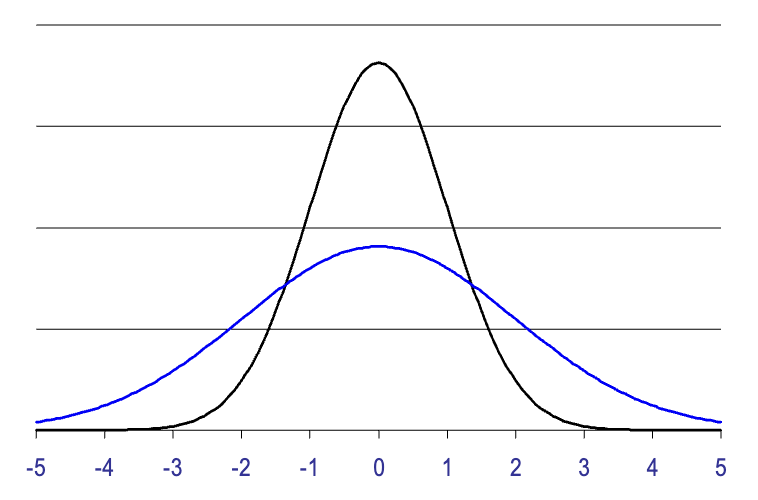
We often assume investment returns follow a bell-shaped symmetric distribution, motivated by probabilistic modeling and the central limit theorem.
- Bell-shaped and symmetric.
- A benchmark model of randomness.
- A useful approximation justified by the central limit theorem.
Confidence Intervals
If returns are normally distributed, then approximately:
- 68% of observations fall within \(\pm 1.00\) standard deviations of the mean.
- 90% fall within \(\pm 1.65\) standard deviations.
- 95% fall within \(\pm 1.96\) standard deviations.
- 99% fall within \(\pm 2.58\) standard deviations.
Example: if the average return is 22% and the standard deviation is 42.5%,
\[ 22\% \pm 2(42.5\%) = 22\% \pm 85\% \]
then a rough 95% interval for next year lies between \(-63\%\) and \(107\%\).
Historical Tradeoff Between Risk and Return
Historically, investments with higher volatility tend to have higher average returns, but individual stocks remain much riskier than broad diversified portfolios.
This empirical pattern is one of the central motivations for studying portfolio construction rather than evaluating securities in isolation.
Common Versus Independent Risk
Common risk is also called systematic risk or market risk.
- It affects all stocks.
- It cannot be diversified away.
- Representative examples include recessions, inflation, and interest-rate changes.
Independent risk is also called idiosyncratic risk, specific risk, or diversifiable risk.
- It can be diversified away by holding many stocks.
- Examples include a scandal at one bank or a new competitor.
Diversification is designed to reduce the risk unique to individual investments, leaving behind the risk that is common to the market as a whole.