Many Stocks and Equal Weights
For an equally weighted portfolio, an important approximation is:
\[ \operatorname{Var}(R_p) = \frac{1}{n}\overline{\sigma^2} + \left(1-\frac{1}{n}\right)\overline{\operatorname{Cov}} \]
For large portfolios, risk is driven mainly by the average covariance across stocks rather than by the average stand-alone variance.
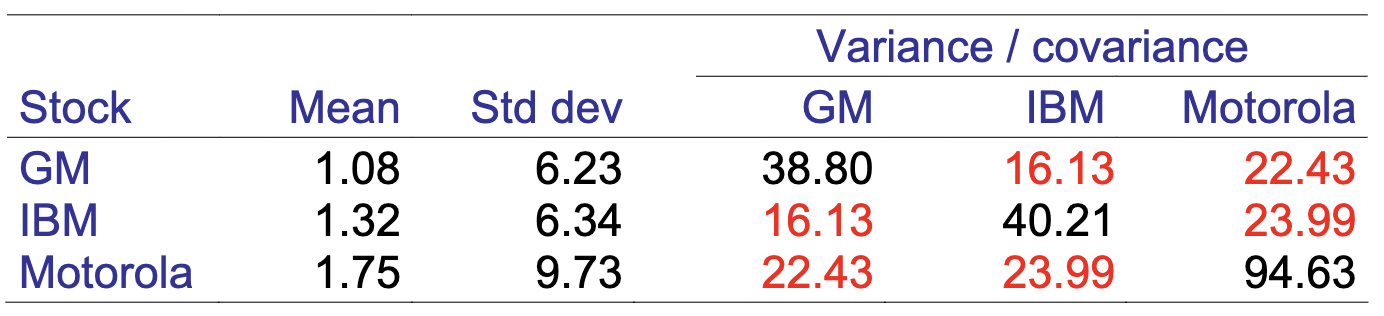
Example
- Average stock standard deviation: 10%
- Average correlation: 0.40
\[ \operatorname{Cov}(i,j) = \rho_{ij}\sigma_i\sigma_j = 0.40(0.10)(0.10) = 0.004 \]
\[ \operatorname{Var}(R_p) \to 0.004, \qquad \operatorname{SD}(R_p) \to \sqrt{0.004} \approx 6.3\% \]
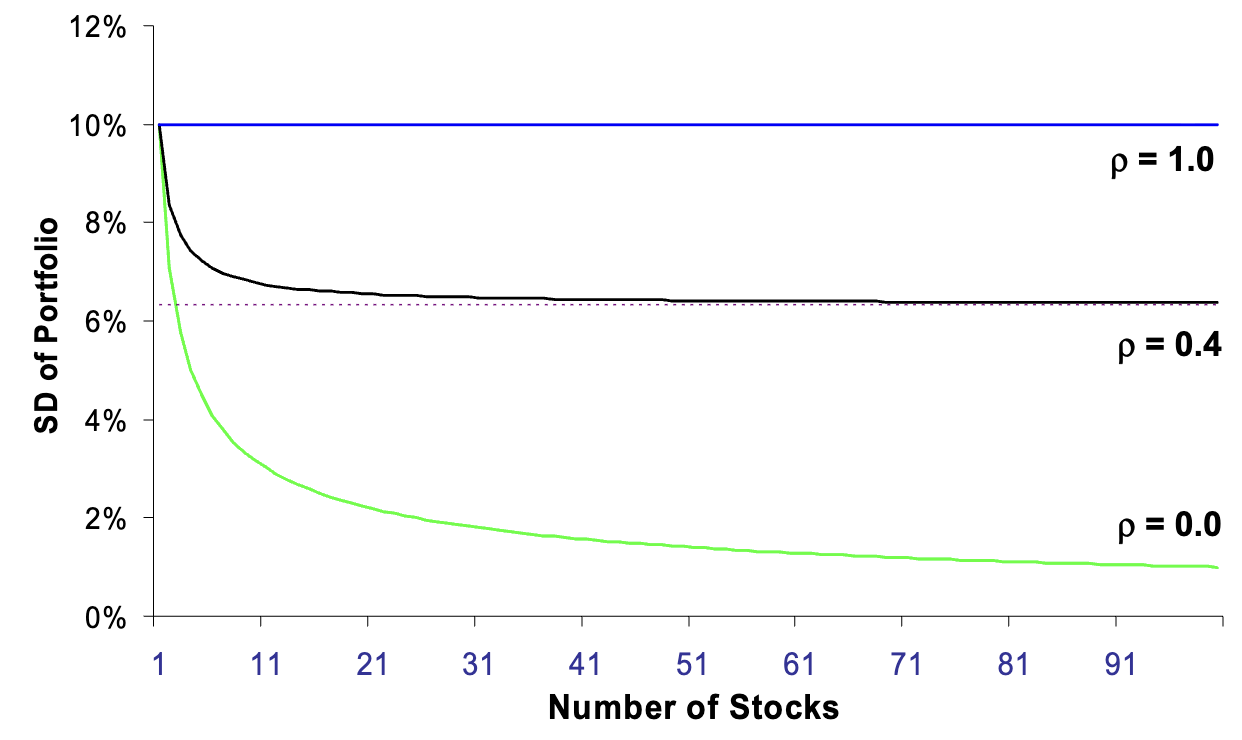
Investors should care most about the risk common to many stocks, since firm-specific risk can be diversified away in sufficiently broad portfolios.
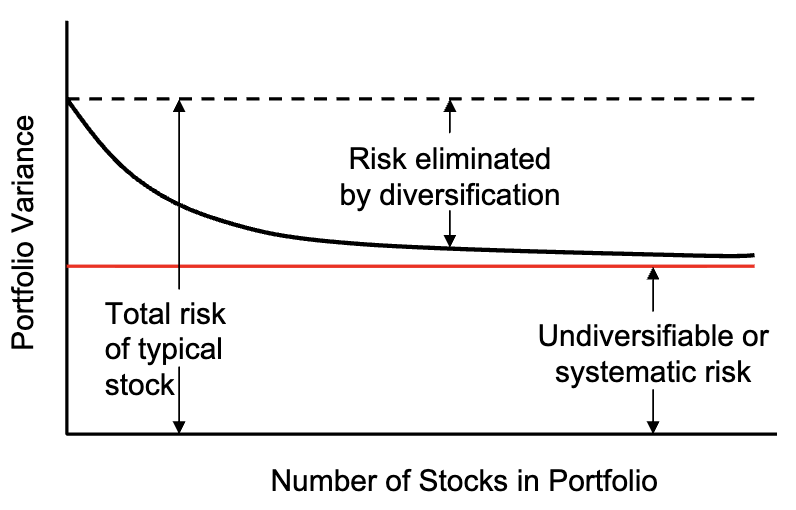
Eventually, Diversification Benefits Reach A Limit
Even with many securities, a non-diversifiable component of risk remains because common shocks continue to affect all firms simultaneously.
Important examples of such systematic forces include credit shocks, liquidity shocks, business-cycle risk, and value-versus-growth effects.
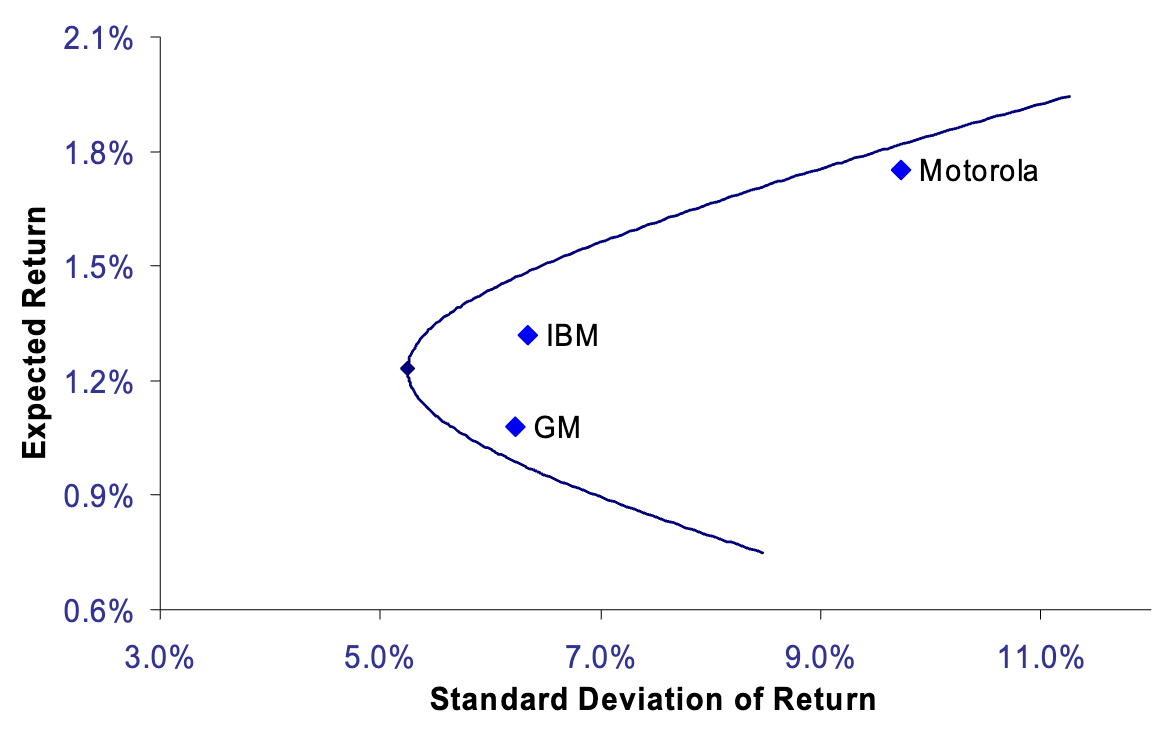
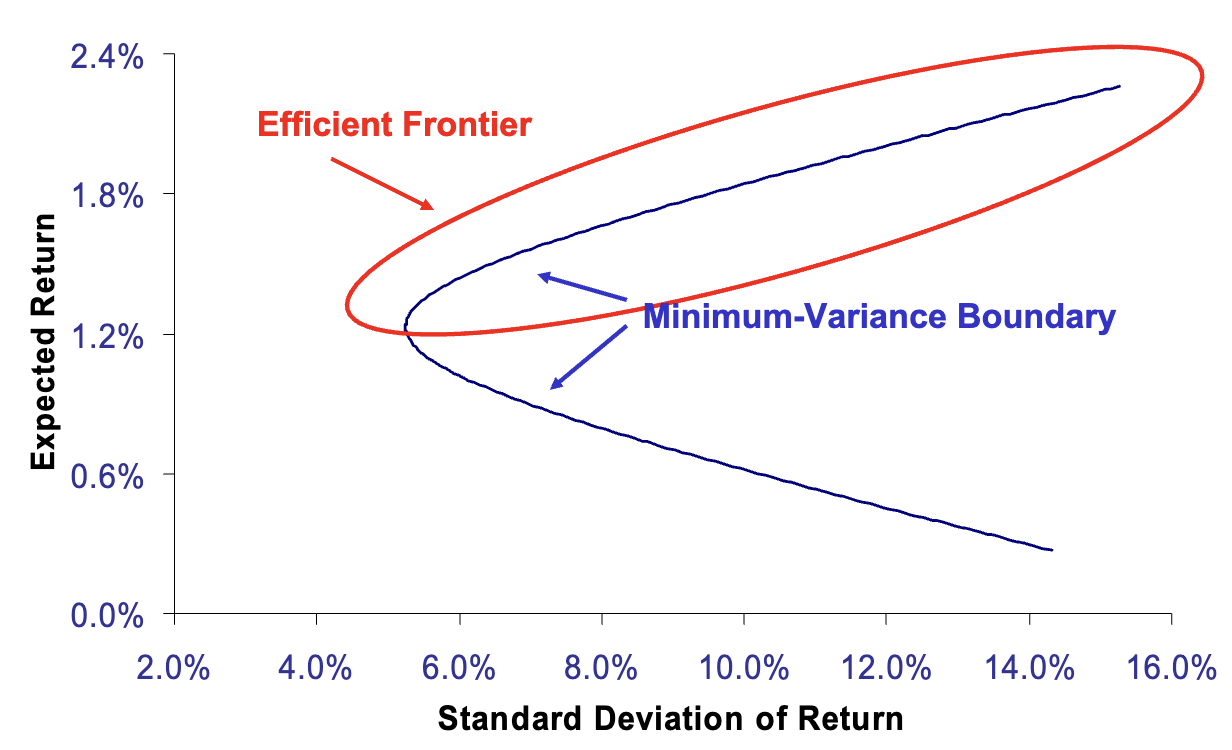
Efficient Frontier
- All feasible portfolios lie in a bullet-shaped region.
- The upper half is the efficient frontier.
- Efficient portfolios deliver the highest expected return for a given volatility.
We cannot easily rank the efficient ones: investors will choose among them based on their own preferences for return versus risk.
An inefficient portfolio is one for which another portfolio exists with both higher expected return and lower volatility.
Adding new investment opportunities enlarges the feasible set and can improve the efficient frontier by expanding the opportunity set.
You can invest in any combination of GM, IBM, and MOT. What portfolio would you choose?